New Products
 Earth-Friendly Products
 Biotium Choice Antibodies
 Special Offers


Content #1
Content #1
Content #1
Propelled by advances in microscopy and the advent of spatial proteomics, seeing more of the molecular orchestra at work in cells and tissues has revolutionized our understanding of biology. With fluorescence microscopy, we can see and measure multiple targets in the cell: proteins in tissues by immunohistochemistry (IHC) and immunofluorescence (IF), and nucleic acids by fluorescence in situ hybridization (FISH). Modern advances in fluorescent dyes, detection, and spectral unmixing technology allow us to image more probes than ever, which is crucial in understanding complex biological tissues (Stack et al., 2014)—multiplexed IHC has shown itself useful in tumor analysis and predicting therapeutic responses to specific cancers (Halse et al., 2018).
Detecting proteins in tissues and cells is commonly done by direct or indirect immunofluorescence, where primary antibodies are either directly labeled or amplified by a fluorescently labeled secondary antibody. However, for low abundance proteins of interest, these techniques may not produce enough light to distinguish specific signal from background autofluorescence. Multiplexing by indirect immunofluorescence is also limited by the source of primary antibodies: cross-reactivity occurs when two primary antibodies are from the same species, so it is typically limited to 3 or 4 colors at best.
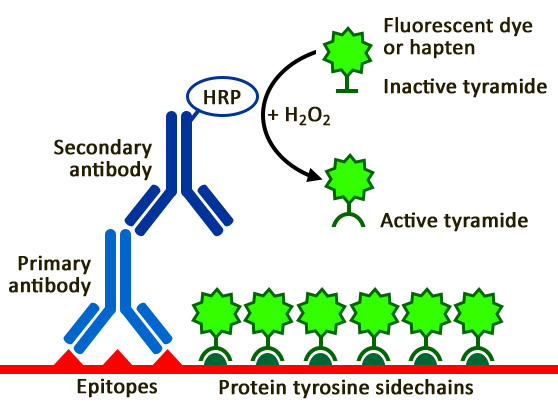
HRP-conjugated antibodies convert inactive tyramide to active tyramide, which then covalently attaches to nearby tyrosine residues. Source: Biotium
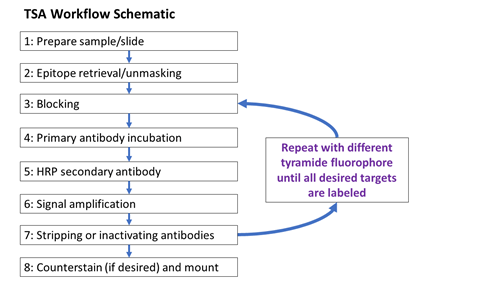
Schematic of TSA sequential staining process (adapted from Opal technology). Repeating steps 3-7 allow concurrent labeling of multiple targets not limited by species cross-reactivity.
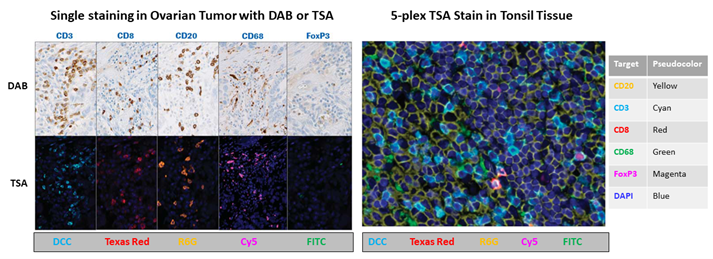
Left panel: Single staining against select targets in a human ovarian tumor by DAB (top) and TSA (bottom). Right panel: Fully automated TSA staining using rabbit primary antibodies and unique dye tyramides allows multiplex staining and distinguishing 5 targets plus DAPI DNA stain. Adapted from (Zhang et al., 2017).
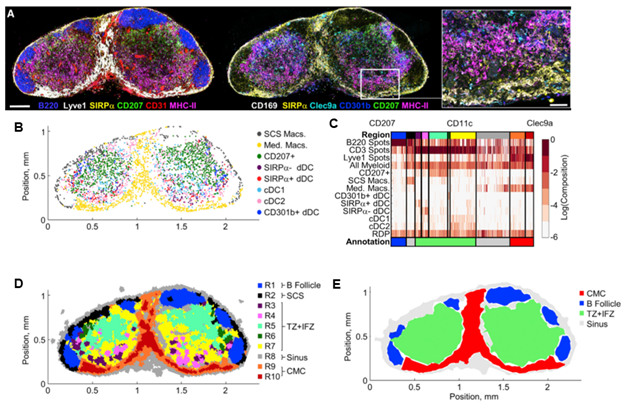
Staining more targets simultaneously allows detailed studies of tissue architecture. Automated spatial analysis (CytoMAP) of 12-plex CF dye staining of myeloid markers in lymph nodes (LN) reveals myeloid organization. (A) Confocal images of a non-draining LN section from immunized mouse. Scale bar=200 µm (50 µm in inset). (B) Positional plots of myeloid cell subsets identified combinations of markers. (C) Heatmap of the cellular composition of 30 µm-radius neighborhoods showing regions defined by SOM clustering (top color bar) and regions defined by manual annotation (bottom color bar). (D) Positional plot of the LN neighborhoods color coded in top color bar in C. (E) Positional plot of surfaces generated on the manually annotated regions (bottom color bar in C). DC=dendritic cell; dDC=dermal dendritic cell; Macs=macrophages. Adapted from (Stoltzfus et al., 2020).
TSA is a powerful tool in research and diagnostics. This method can label more simultaneous targets than indirect IF and can be automated, driving deeper understanding of complex tissues—a key to understanding health and disease and advancing patient care (Stack et al., 2014). With the advent of automated tools to map organ cytoarchitecture using high-dimensional staining with CF® dyes, being able to label more than four colors is more advantageous than ever! Lymph nodes (LNs) labeled with 12 colors allowed automated analysis of cellular organization in this complex tissue, revealing that distinct subsets of dendritic cells (DCs) reside in non-overlapping patterns (Stoltzfus et al., 2020).
TSA offers a flexible and cost-effective path to spatial proteomics, producing bright and high-resolution images. For particularly difficult to visualize targets, TSA can be combined with avidin-biotin complex (ABC) staining for further signal amplification; ABC staining with TSA enhances FISH where increased sensitivity or multiplexing is desired, finding such uses in microbial rRNA identification (Amann & Fuchs, 2008). Finally, immunofluorescence can be used after TSA to expand imaging bandwidth.

Christopher Pratt earned his PhD in cell biology and neuroscience from Carnegie Mellon University in 2016 under the guidance of Marcel Bruchez, PhD. For his thesis, he developed and applied novel fluorescent probes to understand synaptic vesicle and ion channel trafficking in the brain, making him a ardent microscopist. With a passion for communicating science and data, Christopher is a regular contributor to Biotium’s Full Spectrum Blog and is a freelance science and medical writer, analyst, and research consultant based in Chicago, Illinois. Visit his LinkedIn and get in touch!