
Why Use Flow Cytometry?
Flow cytometry is capable of distinguishing individual cells based on size, shape, and expression levels of dozens of fluorescently-labeled proteins as they are zipped past a light source and various detectors. This technique can measure hundreds of thousands of individual cells in minutes—its power is recognized by scientists and at least one former president.
How Does Flow Cytometry Work?
Cells in suspension are pumped through the flow cytometer, where hydrodynamic focusing presses them into a single-file line for measurement. Conventional flow cytometry uses dichroic mirrors and point detectors (photomultiplier tubes or avalanche photodiodes) to measure specific wavelengths after illumination with a laser. For excitation with multiple lasers, the cells are illuminated by one laser at a time in an assembly line, with each laser accompanied by its own set of dichroic mirrors and detectors.
As the field continues to advance, even conventional flow cytometry instruments are now capable of analyzing ten or more colors per sample (Baumgarth & Roederer, 2000; De Rosa et al., 2003). However, adding detection channels to a conventional flow cytometer requires more lasers and detectors that must be meticulously aligned. The spillover of a fluorescent signal into other channels poses another problem: compensation (the mathematical correction of spillover) can obscure the signal of interest if it is faint or poorly separated from other signals. This becomes more pronounced with more colors, leading to less spectral separation.
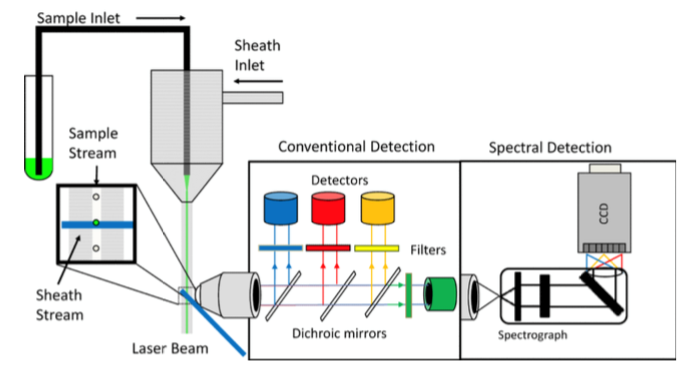
Spectral flow cytometry takes a different approach: Instead of using dichroic mirrors to separate the emitted light, it captures the whole spectrum akin to a fluorimeter. With this spectral detection, the excitation and emission spectra from each laser can be used to construct a unique spectral fingerprint for each fluorophore. Spectral unmixing is the process of taking the observed spectrum and breaking it down into the most likely constituents based on the properties of each dye.
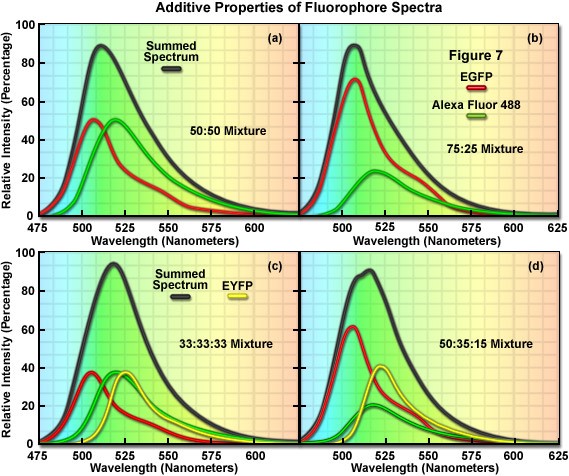
Each dye contributes additively to the whole spectral picture. Dyes with similar emission peaks can be used together in spectral flow cytometry as long as the spectral fingerprints of each dye are sufficiently different.
What Do You Need For Spectral Flow Cytometry?
While existing flow cytometers can be reconfigured for spectral detection, Sony and Cytek™ produce commercial spectral flow cytometers capable of detecting over 40 colors! These machines have different technology under the hood but are both suited for analyzing cultures from tubes and multi-well plates. Sony’s latest offering, the ID7000™, uses a grating for light dispersion and seven spectral detectors while previous models have used a series of prisms. In contrast, the Cytek™ Aurora uses a special type of detector instead of a discrete dispersal element. The proprietary coarse wavelength division multiplexing semiconductor array retains the sensitivity of photomultiplier tube detection but can capture spectral information from 365-829 nm.
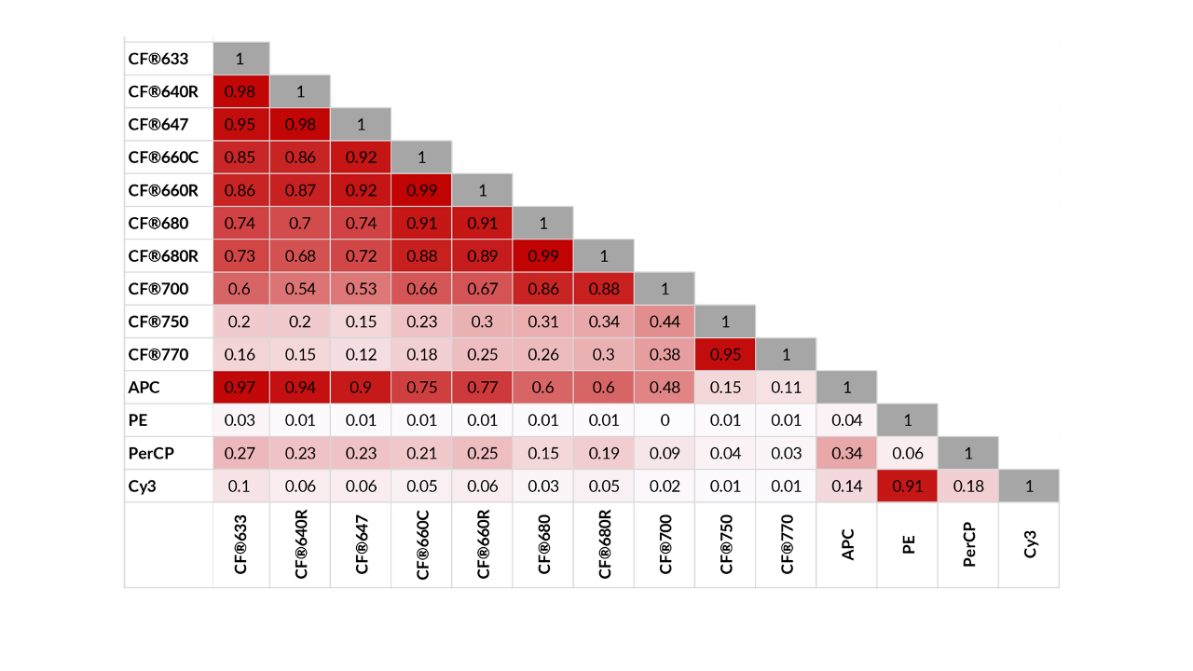
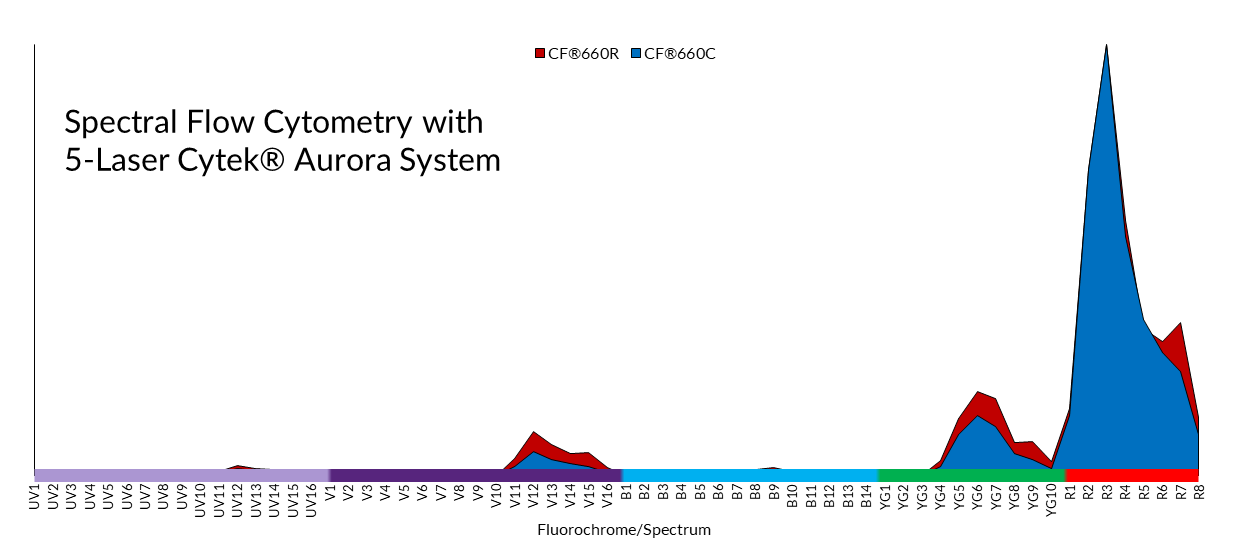
The technology of commercial spectral flow cytometers means that as long as dyes have unique spectral “fingerprints,” you can use many dyes across the color spectrum! This makes dye availability the limiting factor in spectral flow cytometry. A “spectral gap” exists in the far-red region of the spectrum where relatively few dyes are available compared to shorter wavelengths. CF® dyes with distinct far-red and longer emission spectra make spectral flow cytometry experiments with even more colors possible. Even CF®660C and CF®660R, a pairing of very spectrally similar dyes that are not resolvable by conventional flow cytometry, are distinct when measured by the Cytek™ Aurora. Despite this capability, pairing such similar dyes would not be recommended even for spectral flow cytometry.
Concluding Remarks
Spectral flow cytometry makes it possible to measure many dyes without having the user perform mathematical compensation and subtraction. This “whole picture” of the spectrum can be broken down into its constituent parts to distinguish 40 or more labels in a single experiment, limited only by the dyes available. CF® dyes offer labels across the spectrum that are compatible with spectral flow cytometry and fill in the “spectral gap” in the far-red and longer wavelength region to enhance experimental possibilities!
For further reading, check out Biotium’s spectral flow cytometry page.
References
- Baumgarth, N., & Roederer, M. (2000). A practical approach to multicolor flow cytometry for immunophenotyping. Journal of Immunological Methods, 243(1–2), 77–97. https://doi.org/10.1016/s0022-1759(00)00229-5
- De Rosa, S. C., Brenchley, J. M., & Roederer, M. (2003). Beyond six colors: A new era in flow cytometry. Nature Medicine, 9(1), 112–117. https://doi.org/10.1038/nm0103-112
- Nolan, J. P., & Condello, D. (2013). Spectral Flow Cytometry. Current Protocols in Cytometry / Editorial Board, J. Paul Robinson, Managing Editor … [et Al.], CHAPTER, Unit1.27. https://doi.org/10.1002/0471142956.cy0127s63